

Introduction
Given the volatility in the stock market this week, particularly after Monday’s big drop (this was posted on Friday, August 9), I thought there might be some readers of this blog that were wanting to buy some stocks that had pulled back in price but needed an idea of where to start. So, I thought I’d share with you one of the key financial metrics Warren Buffet looks for when he is analyzing a company to purchase.
Warren Buffet is a highly influential figure in the world of investing. Known as the “Oracle of Omaha,” Buffet has amassed his wealth through a disciplined approach based on value investing. His investment strategy focuses on analyzing a company’s fundamentals to find undervalued stocks, making him one of the most successful investors ever.
For any serious investor, understanding Warren Buffet’s investment strategy is essential. It offers valuable insights into how to spot and take advantage of market opportunities while minimizing risks. Buffet’s approach goes beyond simply choosing stocks; it involves carefully evaluating financial metrics, being patient, and maintaining a long-term perspective.
One important aspect of Buffet’s strategy is the strict use of valuation ratios. These ratios help him in determining whether a stock is priced lower than its true value. By prioritizing metrics such as the price-to-earnings (P/E) ratio and price-to-book (P/B) ratio, Buffet ensures that he invests in companies with solid fundamentals at fair prices. This post discusses one specific ratio he uses—Earnings Before Taxes (EBT) to Market Price Ratio—emphasizing its importance and application in finding undervalued companies.
As always, any words in green are links to additional information that you might find interesting
The Philosophy Behind Warren Buffet’s Investment Strategy
Value Investing Principles
Value investing forms the cornerstone of Warren Buffet’s investment strategy. This approach involves purchasing stocks that appear undervalued by the market. The primary goal is to buy shares at less than their intrinsic value, creating a margin of safety for the investor. Key aspects of value investing include:
- Intrinsic Value: Determining a company’s true worth based on its fundamentals.
- Margin of Safety: Ensuring a buffer between the purchase price and the intrinsic value to mitigate risk.
Buffet’s method is rooted in these principles, consistently seeking companies that offer substantial long-term growth potential at discounted prices.
t identifies stocks that not only demonstrate robust financial performance but also align with his long-term investment goals.
Impact of Market Psychology on Valuations
Market psychology significantly impacts stock prices and valuations. Factors such as investor sentiment, market trends, and economic indicators can cause stock prices to fluctuate beyond their intrinsic values. Buffet capitalizes on these market inefficiencies by:
- Contrarian Investing: Purchasing stocks during market downturns when others are selling.
- Long-term Perspective: Ignoring short-term volatility and focusing on sustained growth.
Investing like Warren Buffet involves understanding how psychological factors can create opportunities for acquiring undervalued assets.
Understanding the EBT to Market Price Ratio
Earnings Before Taxes (EBT) to Market Price Ratio Explained
The Earnings Before Taxes (EBT) to Market Price Ratio is an important, yet often overlooked, valuation metric. This ratio is calculated by dividing a company’s Earnings Before Taxes by its current market price. It provides a conservative estimate of a company’s profitability in relation to its market valuation.
Significance
This ratio holds significance for several reasons:
- Conservatism: By focusing on EBT rather than net earnings, this ratio excludes tax effects, offering a clearer view of operating performance.
- Risk Assessment: Helps in assessing the risk-adjusted returns since taxes can vary significantly across jurisdictions and time periods.
- Comparison Tool: Useful for comparing companies within the same industry, providing insights into which firms might be undervalued based on their pre-tax earnings.
- Safety and Success: If you purchase a company with a solid balance sheet, growing earnings, and history of strong shareholder returns at a low valuation, you will make money.
Comparison with Traditional P/E Ratio
While the traditional P/E ratio is widely used, it has limitations:
- Inclusion of Tax Effects: The P/E ratio includes taxes, which can distort profitability comparisons due to differing tax structures.
- Earnings Manipulation: Net earnings can be influenced by accounting practices, making them less reliable.
The EBT to Market Price Ratio offers an alternative that mitigates some of these issues by focusing on pre-tax earnings.
Conservative Estimates
Warren Buffet prefers using conservative estimates for valuing companies. The EBT to Market Price Ratio aligns with this philosophy by providing a more stable measure of profitability that is less susceptible to fluctuations caused by tax policies or accounting adjustments.
In assessing companies through this lens, Buffet identifies stocks that are undervalued based on their operational performance rather than solely relying on net earnings figures impacted by external factors.
Understanding and utilizing valuation ratios like the EBT to Market Price Ratio allows investors to conduct thorough company assessments and make informed investment decisions grounded in fundamental financial metrics.
Using the EBT to Market Price Ratio for Investment Decisions and Identifying Undervalued Companies
Calculating The Ratio
Finding this ratio already calculated on a publicly available website is tough. I’ve never seen it and have always calculated it myself.
You can calculate it for just about any company using Yahoo Finance and choosing the Financials link. You just need to find two pieces of information:
(1) Pre-tax Income in the Income Statement tab; and
(2) Total Capitalization in the Balance Sheet Tab.
Divide (1) by (2) and if it is less than 10, you have a candidate that fits this valuation metric. [Remember to account for dropped zeros if needed]
If you subscribe to certain investment services, they may have a stock screener that can provide you a list of companies that meet this ratio. Here are a few:
Finviz
- Finviz is a popular stock screener that offers a wide range of filters. While it doesn’t directly offer an EBT to Market Price ratio, you can use the “Custom” tab for specific metrics if you have access to Finviz Elite (paid version). You might need to manually calculate the ratio outside of the screener, though
TradingView
- TradingView allows you to create custom scripts using its Pine Script language. You can create a custom screener by coding the EBT/Market Price ratio and then filtering stocks accordingly. TradingView offers both free and paid plans.
Yahoo Finance
- Yahoo Finance offers basic screening tools. While you can’t directly filter by EBT/Market Price, you can download financial data and perform the calculation in Excel or Google Sheets.
GuruFocus
- GuruFocus is a premium service that provides extensive financial data and ratios. They allow for custom screening and offer pre-built screens that might approximate what you’re looking for. You can also create your own screener using their platform.
Zacks
- Zacks offers a customizable stock screener where you can select from a wide range of financial metrics. With a premium subscription, you might be able to build a custom ratio, although this platform is more geared towards predefined metrics.
It’s More Than Just Valuation
You can generate a list of companies that meet the valuation ratio, but that doesn’t mean each of them is necessarily a company you would want to buy. The list is just a starting point.
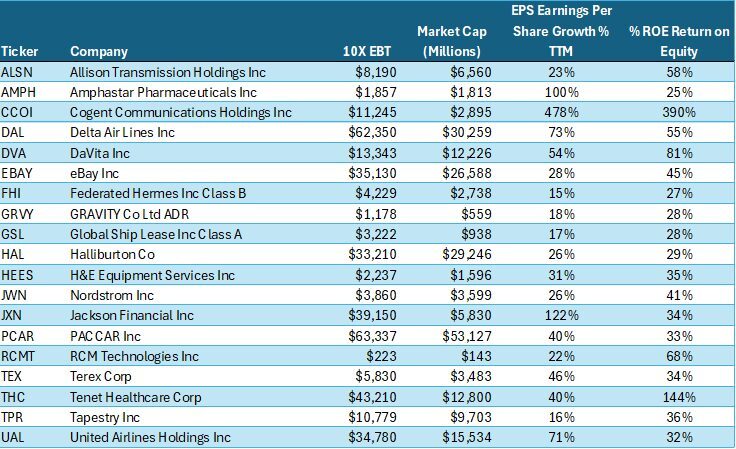
In the table below, I screened my database of companies instead of using one of the paid services above – I track about 1500 companies of all market capitalizations – using this valuation ratio along with requirements that the companies have both Earnings Growth > 15% and Return on Equity > 25%. These two specific ratios are always my go to to narrow a list of companies for further research because I believe firmly in the growth style of investing.
Of those 1500 companies, only 19 met these three criteria. For me, this is a good place to start looking for high performing bargains.
For you, there may be other key items you would want to filter on in addition to valuation – a ratio for balance sheet safety, like Debt being less than 35% of Equity to locate Safe companies for example. That list yields 82 companies that are available to research. Or maybe you want to filter on companies that pay dividends in addition to valuation – a ratio of companies with a dividend yield > 3% that are also Dividend Aristocrats with a history of raising their dividends in more than 25 consecutive years. That list yields 28 companies.
But remember, this is just a start – further due diligence on the names on your list will show you that some have growth ratios that are not sustainable when you look at EPS Growth or ROEs over 5 or 10 year periods or they have balance sheets that do not fit your quality standards or they may be in an industry with secular challenges that present too much risk. A list is just a list – its not a commandment to buy any of the companies on it.
Your investment objectives are different than mine and most likely different from everyone else because your particular life situation is unique. You have to do your own due diligence to find stocks that meet your specific objectives. But using this favorite ratio of Warren Buffet can give you a good place to start – attractively valued companies – and from there you can look for companies with clear runways for growth, or companies with high safety quotients, or companies that provide you with a nice cash flow stream. Heck, you can even find companies that meet at least two of these objectives as well as others not listed here. You just need to do the research before you buy.
Closing
Thanks for reading the blog!
Part Four in our series on the National Debt Crisis is partially written and I hope to have it published soon, so check back or simply subscribe to the blog at the link above to get a notice when a new post is made.
Mark