Fraudsters may try trick you into sharing your information. BankChampaign will never call you to request account numbers or online banking credentials.
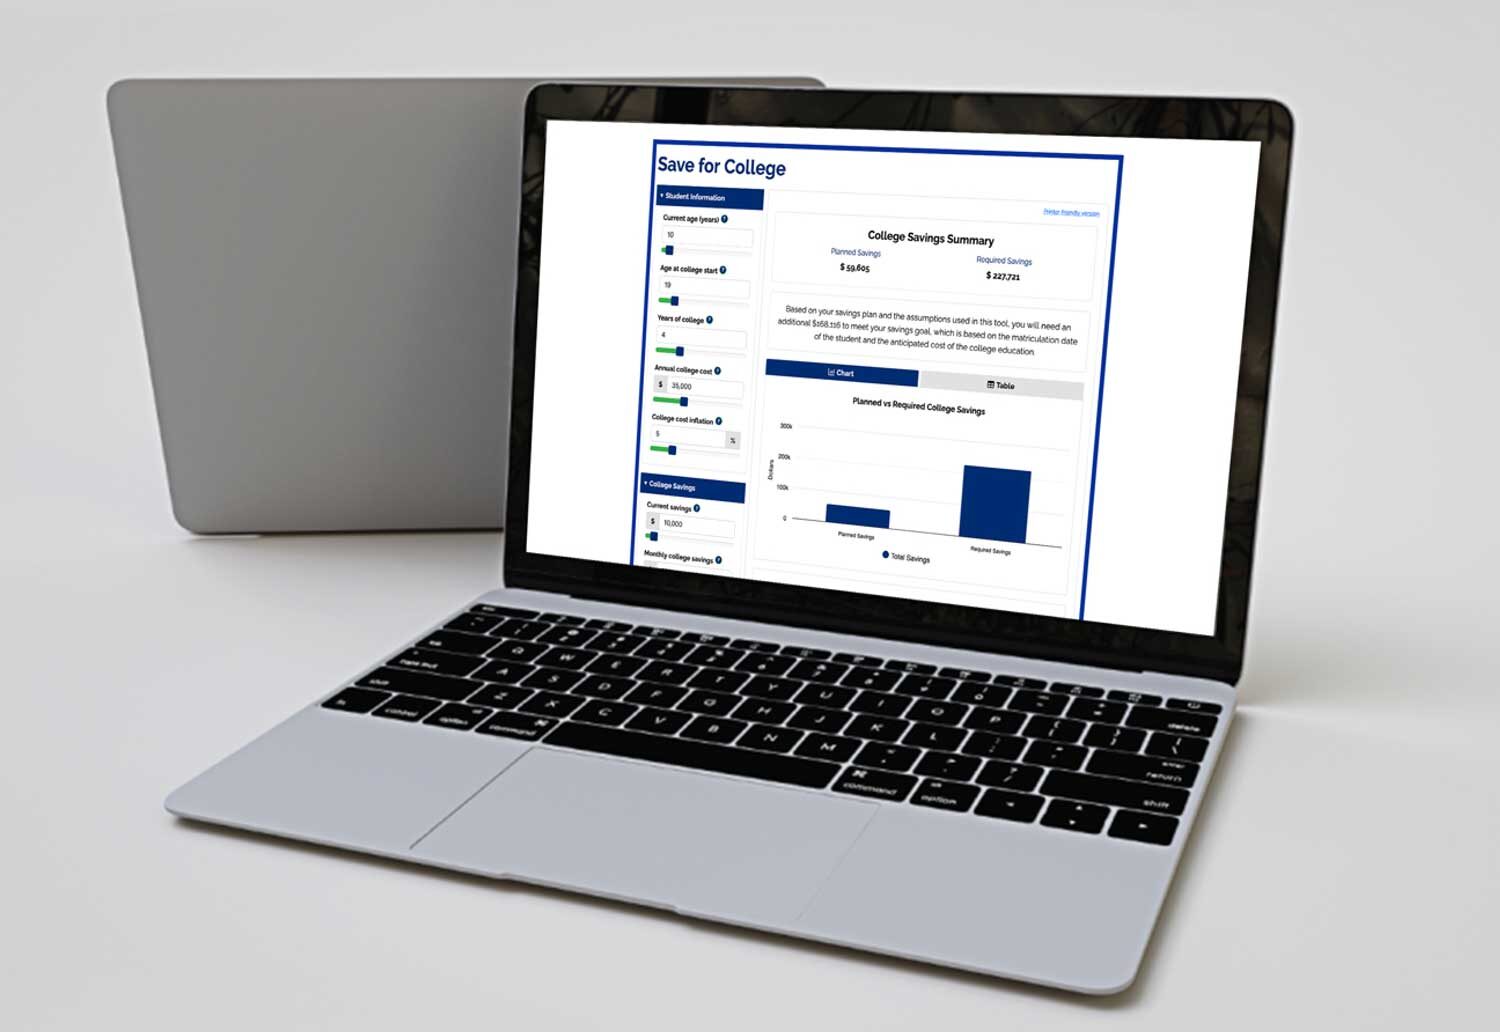
Unlock your financial future with these tools – easily evaluate debt, retirement savings, home buying costs, and more to make informed decisions and reach your goals.
Whether you’re a seasoned entrepreneur, a diligent saver, or an aspiring investor, our comprehensive resources will help you navigate the intricate landscape of business, personal finance, and investment strategies. Explore how BankChampaign can support you no matter where your journey takes you.
Personal Financial Journey
Explore topics including home ownership, family finances, career development, and retirement planning tailored to empower your financial journey.